Dec 11 2009
Quick Tip: Detailing Web Intelligence Document Contents
This tip comes courtesy of Joe Szabo. I met Joe many years ago at a common client. A few weeks ago we had a casual conversation in the hallway at the 2009 GBN conference. I don’t remember how we got started but the subject of documenting complex Web Intelligence reports came up somehow. I was probably complaining and Joe said something like, “… but don’t you just do blah blah blah? That’s what I do, and it works great.” This post is going to be all about the “blah blah blah” that Joe shared with me. It will help you provide documentation for complex Web Intelligence reports. It will even help debug reports. And best of all, it will help determine exactly what is different between those two different versions of the same report so you can make sure the right version gets migrated into production.
I am going to show screenshots from Web Intelligence 3.0 for this blog post but the same process works in XI R2 as well.
Setting Up The Scenario
To start I need to make sure that my preferences are set for viewing Web Intelligence documents via Infoview in the “interactive” viewer. This is done by clicking on the preferences option (in XI R2 it’s an icon, in 3.x it’s a text link in the menu bar) and selecting the proper viewer under the Web Intelligence configuration area.
Next I created two documents from the eFashion universe. Or rather I created one document, saved it, made a small change to one formula, and saved it under a new name. Now I have two very similar documents and need to find out what is different. The formula in question is simple enough for this scenario: I take the Sales Revenue and multiply by some factor to get a projection. I specifically did this as a formula rather than a variable for this demonstration. For the second version of the report I changed the projection factor.
Interactive Viewing Sidebar
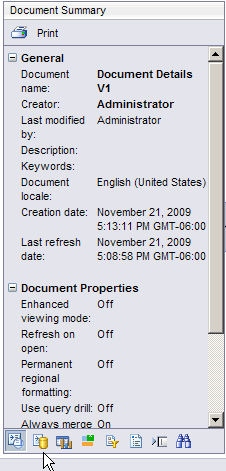
Here’s the trick that Joe shared with me. While viewing the document in interactive mode there are a number of choices that can be made as far as what to show on the left sidebar. The sidebar for 3.0 is shown in the screenshot to the right. It starts out in “Document Summary” mode. (Before I go too much further I should note that the same features in XI R2 are selected with a drop-down selector instead of buttons as shown here, but the results are the same.) Document summary shows the name, author, keywords, and other information that can be updated from the “save” dialog box or the document properties. It’s interesting enough, but it doesn’t help me check for document changes.
But before I go further, look very carefully at what appears just under the sidebar heading… there is a printer icon. And just in case that isn’t clear enough, the word “Print” also appears. 🙂 Clicking the print icon doesn’t actually print the data shown on the sidebar, at least not right away. What it does is invoke the print process so you can determine how much of the data you want printed.
I will come back to that in a moment. But first, I want to review each of the options presented here as icons and in XI R2 as drop-down selection options.
Here are the rest of the icons from 3.0 enlarged to show detail.

The icons are (from left to right):
- Document Summary
This pane shows overall document properties, keywords, and other summary information - Data Summary
This pane shows data provider details as well as formulas and variables. - Chart and Table Types
This pane shows templates for various block types. This information is available when creating documents too, of course, but having it available here allows an interactive viewer to change how a report is displayed. Cool stuff. - Available Objects
This pane allows an interactive viewer to see (and therefore drag-and-drop) available objects from a data provider, formulas, or variables onto the report. An interactive viewer can even create new variables on this pane. - Document Structure and Filters
This pane allows an interactive viewer to see the document in “outline mode” which shows both page and block layout configuration settings. - Navigation Map
This pane allows a user to navigate through sections on a report. This is driven by the content of the report rather than the structure pane listed above. - User Prompt Input
This pane will allow a user to review prompt selections. - Find
This pane is probably self-explanatory. 🙂 It’s nice to know that it’s there and I expect to talk more about how it works in a later blog post.
So which one of these is the “magic button” as far as deciphering document differences?
Data Summary
The second button (Data Summary) is where I want to spend the rest of my time for this blog post. When I click that button the outline for my simple document looks like this:
Data source
 Query 1

	Universe: eFashion (Oracle)
	Last execution time: 5 s.
	Nb of rows: 1016

 Objects

 Query 1

 	Lines
 	Product line. Each line contains a set of categories.

 	Quarter
 	Quarter number: Q1, Q2, Q3, Q4.

 	State
 	State located.

 	Year
 	Year 1999 - 2001.

 	Sales revenue
 	Sales revenue $ - $ revenue of SKU sold

 Formulas

 	=[Sales revenue] * 1.025
Now did I sit here and type all of that into my blog post? Nope. 🙂
What I did was click the “print” icon. I mentioned this earlier when talking about the Document Summary panel, but it appears on the Data Summary panel as well. Clicking the print icon generates this popup window.

If I leave everything turned on and click the OK button the following content shows up in another window.

Now here’s the best part. Clearly I can print from this screen. But I can also grab everything and copy / paste into another application. This is very cool stuff. 😎
Comparing Reports
I use a text editor called UltraEdit that I am very happy with. One of the many features it has is I can compare two different files. I’m not saying you have to run out and purchase the same tool I have. All you need is some sort of program that will let you compare the contents of two different files. (If you run unix you have one built in; see the manual page for the diff command for more information.)
I copied the entire contents of the data summary output for version one of my document and saved it as document_v1.txt. Then I did the same to version two and saved it as (of course) document_v2.txt. Finally I ran the compare tool against these two files. I mentioned earlier that the only thing I changed was a single value in one formula. Here’s what the compare results showed.
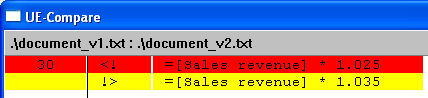
The only difference between these two Web Intelligence documents is clearly shown. This is nice. 8)
What About More Complex Changes?
There was only one change made for this simple scenario. I added some new objects and a new variable to version 2 of the document and reran the compare using the same steps outlined above and here’s what I got.
6	 <! Last execution time: 14 s.
7	 <! Nb of rows: 10272
	 !> Last execution time: 5 s.
	 !> Nb of rows: 1016
22	 <!  Store name
23	 <!  Name of store.
24	 <!
28	 <!  Quantity sold
29	 <!  Quantity sold - number of SKU sold
30	 <!
34	 <!  Document Variables
35	 <!
36	 <!  Test
37	 <!  =[State]
38	 <!
41	 <!  =[Sales revenue] * 1.035
	 !>  =[Sales revenue] * 1.025
It captured the different run times and row counts. It showed that the Store name object had been added to the second version. It showed that a new variable existed in the second version, and of course it still captured the fact that the constant value was changed from 1.025 to 1.035 in the second version of the document. The way I know this is everything with <! is from the newer “v2” version, and everything tagged with !> is from the older “v1” text file. That’s how UltraEdit works. Other tools will likely be different.
Now imagine if I were working with a complex document with hundreds of variables and formulas and maybe a dozen or more data providers. I am told that there is “something different” about the two documents but I can’t tell exactly what just from a quick look. I now have a process that will identify exactly what is different as far as data providers, variables, and formulas. That’s a huge savings in time and effort.
So thanks, Joe, for sharing your tip.
As a final note, doesn’t Joe have a great name for working as a Business Objects consultant? 😉 His brother Frank won a drawing at one of the Insight conferences in Florida a few years back and the emcee had fun calling out his name. Frank… ZABO? Is Frank here? Frank Full-Client maybe? 😆
What About Desktop Intelligence?
One of the advantages of Desktop Intelligence is that it’s open to manipulation via VBA. It’s outside of the scope of this post to provide full details, but I have in the past written code to extract information from various full-client reports and save it into various formats. It would not be a major stretch to apply the same text compare process in order to determine differences between two versions of the same desktop report.
Conclusion
Usually when I learn something new I immediately try to see how far I can take it. It turns out that this trick doesn’t go much further. Of the eight icons on the sidebar only two of them have a print feature: Document Summary and Data Summary. The same techinques could be applied to the output from the document summary but I think the data tab is much more useful.
I should also remind folks that the text editor UltraEdit is not required; it’s just a tool that I have available. There are many free or inexpensive tools for comparing the contents of two text files. The output from UltraEdit is handy in that it can be color coded (as I showed in the first screenshot) or saved to a text file (which is what I used for the second set of output) instead.
Finally, I hope that I have accomplished one last but important thing with this blog post. Joe seemed really surprised that I had not encountered this feature before. To be honest, I do not spend much time in Infoview. I am usually using the java panel for report development or debugging efforts. Since I don’t spend much time in Infoview I haven’t spent that much time checkout out all of the features, and therefore had never seen the “print” icon that was available even back in XI R2.
My point is this: everyone has something to share. Some of the techniques that you may use every day without thinking twice about them might be new and exciting to someone else. For every person who read this blog post and thought to themself, “I already knew about that” I bet there are a dozen or more that are going to say, “Wow, I never knew I could do that!” So go ahead and do a presentation for your local user group. Write a blog post. Share something on BOB. Pay it forward. Pass it on. Your mileage may vary. Batteries not included. All that stuff.
You might just save someone else a lot of time, and feel good doing it. 😎
This is a great tip! Thanks for sharing it. I happen to use UE/UC too, so I can implement this as soon as I need it.
Thanx Dave (& Joe as well)….Very Cool (as always)
Could you post some directions for XI R2 since we cannot find the print option.
Hi, I included notes in XI R2 in the post. I just didn’t include screen shots.
First, you must be in “Interactive” viewing mode. Second, the options are not selected with buttons but with a dropdown control. Once you do that, there is a print icon just below the dropdown selector that you can use.
I read your “Universe Models for Recursive Data”. It is great, informative and very helpful.
I am new to BO, and I can not figure out how to build drilldown of “Tree Traversal” you mentioned on page 43. can you provide some details? Do you have some samples to share?
Thanks a lot.
I’ve done this, but My document property window looks different and I cannot find the dropdown. I’m using the interactive Java webi report editor. Is there a version or other requirment that I’m missing?
You have to “View” the report rather than modify, and it’s going to be on the left panel. In some cases the left panel can be minimized (closed) so you have to make sure that it’s visible. As long as it’s visible, and as long as you have “interactive html” selected as your viewer, you should see a dropdown selector with Document Summary, Data Summary, and so on listed. Data Summary is the option that gives you what I have described in this post.
Hi, Wei, and thanks for your comment / question about the recursive data model presentation.
Yes, I have some samples / examples, and they will be posted when I start writing the blog posts about this presentation. I don’t expect to get those done until sometime next year. I’ve already written most of what will be published in December and early January so I can take some time off. 🙂
Bingo! found the option. This interactive mode is a quite well hidden but powerful feature!
Wow, I never knew I could do that! Once again, Dave, ya da man! This is exactly what I was looking for as I have a few hundred WEBI reports to get documented. Now if there was only a way to make the Variables in the list expand.If you have to many characters in your variable, there is a link that says “more”. Click on it and it opens a small window, but you can’t copy from it, aarrgh!@. Ah well, can’t have everything!
Thanks this saves me hours of copy/paste into a word doc!
Very well detailed Dave, I’m pleased that you thought to take the time to share it with everyone here in such a superbly documented way! I would often dread the ‘documentation’ part of our tasks on projects and was glad to have found this trick which is not only be a ‘cool’ way to get up-to-date documentation out of our reports, but it also helps me keep a reference of some sometimes “creative syntax examples” used in report variables.
This trick allows me to easily assure my customers that the ‘report documentation’ is very accurate since it is sourced from the reports themselves. It’s sometimes been quite irritating to have created a report then have the specifications changed, only to have to go back and update the report and also (tediously) update the documentation too. This still requires a duplicate effort or step, but it is more ‘streamlined’ and accurate.
Another trick is to consider ‘what to do for documenting a universe ahead of the delivery’. Often project plans call for a mock up well before the universe (or reporting tables) are ready, which would cause me some concern until I thought to go ahead and create a blank universe with no tables or connection.
What’s the point? You can create all your classes and objects complete with descriptions and all neatly organized. Then you can save the universe as a pdf and presto, you have instant documentation for your universe. PM’s love this and so do new users who have not seen or are familiar with universes. Some of you have no doubt figured out that you can also use the universe designer tool to provide (post) documentation of your universe too.
`joe
Hi, Joe, thanks for stopping by. 😎
Excellent tip Dave. Thanks to both of you & Joe.
One limitation I found is if your formulas are lengthy (170+ characters) the entire formula is not displayed in the panel or in the print window. In the panel you do get a hyperlink labeled “More” which if you click on it a new window opens displaying the entire formula and you can cut and paste the entire formula from this window. This could be very tedious if you have a lot of formulas that are over the 170+ characters in length.
Hi Dave,
Thanks for all your explorations. I was working around with the new concept ‘input controls’ in Webi XI R3 . I would like to know how can this be utilized to the fullest.
thanks
Hi, Rajesh, and thank you for your comments. If I cover that subject it will be in a new post, rather than as a response to a comment. Thanks.
Thanks for the tip. Is there any way we can achieve the same/similar with deski reports? I am on BOXIR 3.1 SP2
Hi, thanks for your question and welcome. With Desktop Intelligence documents you can easily write a script to extract the same information. In fact, there may already be something in the “downloads” area on BOB to do the same.
Is there a workaround on (170+ characters) limit, especially on Document Variables. How can we print all the details without the more link.
Hi,
Could you please let me know if there is any explanation for a macro(for any purpose,ex: saving as excel in some path) to be run automatically after a deski report gets refreshed in WEBI?
Thanks,
IssKumar
This is excellent news. Like sskumar I too would like to be able to do this via a macro. Perhaps a perl script may be used for this purpose? Maybe using WWW::Mechanize. I don’t think the sdk allows for retrieval of document variables.
Unfortunately it’s proving to be a tad more difficult to extract this info using perl than I thought it would be due to the amount of javascript calls that webi uses.
Dave, is there a way to use this type of interactive viewer via the Web Services or other SDKs? They seem to call what we use an Interactive viewer, but it’s missing the ability for users to filter, remove columns etc. We need to deliver reports to external users, but we lose many of the features that are nice to have. On XIR2 but 3.1 due in production in June on SP3
Hi Dave,
Hope you are fine. I have two questions
1)A report is running for 20 mins for the past two days. The next day the report is taking 50 mins to run. The report has no prompts. In the report side I have not made any changes. How to debug this?
Where the problem could be? why suddenly report takes more time to execute?
2)A report has 7 columns and 50 rows of data. In one row alone in the last three columns there is #Multivalue error.But the all the rest of the cells are with data. How that on one particular row for the last three columns the #Multivalue error can occur? How to approach and resolve this?
I request you to post on what is #Multivalue error and in what situations it occur and how to resolve it?
Regards,
Ramanathan S
Hi Dave,
Please reply to the question which I have asked in the above comment?
I am waiting for your reply
Regards,
Ramanathan S
Hi Dave,
I could not find the option in BO Infoview XI 3.1…could you please help !!!
It’s the same as 3.0 on my installation. It looks the same as the screen shots posted in this blog post. Make sure you’re in interactive mode to see the full set of options.
Hi Dave,
This is very useful indeed, especially when my colleague recently wanted to document this for all the reports built. Do you know how can we export the query filters and report filters as well?
Thank you.
How do you take care of (..more) i.e. when the variable definition is long enough? It does not appear in the print window as well.
Hi Dave,
I tried looking for this option in BO 4.0 Launchpad; however I am unable to find.
Did you get a chance to look at BO 4.0; the “Interactive html” is also not present. Could you assist !!!
Can you tell me how to work with xir3.1 sp 3. i cant really see those icons in my infoview portal.
This is cool….. Thanks, Dave.
Is there a way we could document the Data Summary tab for all the webi reports in an excel?
This would be really helpful in terms of searching and documentation.
Please let me know, if you have used any of this.
Without delving into the SDK I am not aware of any solution for this.
Where did “Data Summary” move to in BOBJ version 4.0? I see the “Document Summary” still in the left navigation, but I don’t see the “Data Summary” which is the one I used all the time in the older version.
Hi, I’m wondering what the previous poster also asked… this is exactly what I’d like to do, but I can’t find the Data Summary option in 4.0. Can anyone help??
Just figured this out. There was a setting in CMC to enable “Data Summary” Option. After granting it, I was finally able to see the data summary. Hope this helps
Hi Dave,
Greetings from Pune India.
http://scn.sap.com/thread/3465376
Am lost a bit too much and hence thought would check with you as to whether we could achieve this by any way.
I could not find much on SDK as well nor did I find any online tool which could help me collating this kind of reverse mapping.
Could you please help me with your inputs or much easier ways of collating this data which am wanting to do.
Many thanks.
Kind regards
Indu
How to do the listing of variables in 4.1 as interactive method is no more available
what is that setting in CMC which enables Data summary Tab ..it would be a great help .. if anyone is aware of that option
You are brilliant.. .Thanks so much….
I’ve come across your posts many times over the last three years while trying to figure out BOXI R2. Again you have provided exactly what I needed. Thank you very much!
Has anyone figured out a way to do this in 4.2 since this feature has been removed?