Nov 09 2009
Making Up Data Part I: Personal Data Providers
Linked Details Are Your Friend
Earlier I was very careful to reset the qualification of the month name data from my personal data file to a detail. I made sure that the detail was associated with the month dimension. Now I can show why I did that. The month name currently on the block is from the first data provider which only has six rows. My personal data provider has twelve rows and therefore is not missing any months. All I have to do is select the month name from that second data provider and drag it onto my report block. Once I replace the original month name I see this.

Now my month numbers are nicely filled out, and my month names are all provided as well.
Earlier I said that merged dimensions contain all values from either side of the relationship. Details cannot be merged. But if a detail is associated with a merged dimension it can be used in the report block to add the missing data. So far the steps I have taken have ensured that all twelve months are showing on my block, and all twelve month names are also present.
But I still only have six sales values. I could consider fixing this with a custom format; when creating a custom format I can set the cell to display $0.00 if it’s null (empty). Unfortunately that would not generate the proper results for a count or average calculation. An average of my sales over six months is $1,214,408. But my average of the six values shown on the report over twelve months would be $607,204.

The issue as shown above is that the average calculation will ignore the empty cells. If I want a true average I need to make up some more data.
Making Up Numbers
Earlier I created a spreadsheet file with a complete list of month numbers and month names. I am going to open that file and add one additional column that will be used to fill in the missing sales numbers as well. Here’s what that looks like.

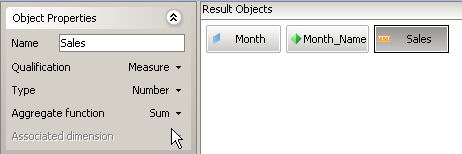
After saving the updated spreadsheet file, I will go back into the query panel and “edit” my personal data provider. That means that I get to work my way through the same process as before. This time I also check to see that my sales measure has the proper qualification and projection function.
The next step is to get this value on the report. The problem is that I have two measures, and there is no process to merge measures like I have for dimensions. That’s not what I want anyway. Instead what I am going to do is create a new measure using the variable editor. The formula is quite simple as shown below.

By adding the two measure values together I am combining the values found in each of the two columns. Now I can replace the original measure with the new Total Sales measure I just created. Here are the results after doing that.

Finally everything looks good. 😎 The last challenge is to keep it looking good.
Hi Dave
Very intresting post. I think it will help me in my report. It’s a report showing the hours worked in every two weeks. My problem is that I will need to show weekends also but people do not work on weekends. I will then use you trick to do that. The other problem is that I show my table header like this:
weekDay: Monday Tuesday Wednesday ...
DayNumberInMounth: 15 16 17 ...
But as these days will change every mounth it will be complicated to do this.
Do you have any solution for me
Regards,
Nidhal
Hi, Nidhal, welcome and thanks for your comment. After thinking about it a bit I think I have a suggestion. It seems that your data always starts on Monday, is that correct? Do you have access to create objects in the universe? What I would probably do is create a “day in reporting period” object that ranges from 1 to 14. This would be done in the universe rather than the personal data provider. Then you can derive the day number of the month by getting the minimum date (which should be the first Monday) and then using the RelativeDate() function to move the date forward from there, then use the DayNumberOfMonth() function to return the day number from the calculated date.
That’s all off of the top of my head, I didn’t test it, but hopefully the concept might spark some ideas on your end. 🙂
Dave, I have not yet used rich-client, but in Webi if you move from the query tab to the report tab after making changes without refreshing it requires a purge of the data. That would foil the cached results for the local data provider. Can you move from query to report in rich client without purging?
Chris
Chris, the query panel for the rich client works more like the query panel for Desktop Intelligence. When you click “Edit query” a new window pops up. If you make any changes you can either run the query or close the query panel. If you close the query panel after making changes, it will tell you that you’re about to lose your changes and ask you to confirm.
I just reconfirmed that in XI 3.0 before posting this.
Dave, great post — thanks.
I have a suggestion. Instead of using an external file, users of Oracle can use the “connect by level” function to generate any number of values. Thus, generating a list of months can be done in one SQL statement, as so:
select level,to_char(to_date(level,’mm’),’Month’) from dual connect by level < 13
This will produce the same month number/month name list that you used in your example.
Nidhal,
One method we used in the past for a report similar to yours was to simply use a CrossTab. The trick to what you want can be done rather easily using a union query. Cross tabs will show values in the headers anywhere there is data. We had access to the database so we created a ‘dummy’ record that had a value of .0001 in all 7 days and we simply forced that record to be returned in our query. You could probably achieve the same results via a union query. Once it was in the recordset we hide the row ( I cannot remember if filter worked or not) and excluded it from any total formulas. The result was that we’d see all 7 days even if there was no data for a given day (since our dummy record did have a value the column in the cross-tab was always created properly).
This may or may not be easier than modifying the universe.. it all depends on what you have access to.
Dave,
do you know whether the personal data providers in Webi Rich Client now have the functionality that would allow the webi docs to be scheduled? There was some speculation that this would be in XI 3.1 SP2…
James
Hi, Dave! The site is great. I’m actually using this method to get back in touch with you, as I have a quick question. Please ping me when you get a chance. Best, Cynthia
Nice post Dave 🙂
Does this work in BOXI Etnerprise R2? I do not see add a new data provider when I right click on the Query tab.
Hi, Lauren, and thanks for your comment.
XI R2 does allow multiple data providers, but you can’t use Excel. Personal data providers are only available starting in XI 3.0. As far as adding a new query, in the Java query panel you can add a second dataprovider by right-clicking on the query tab. I never use the HTML query panel so I don’t know how it works there. There is also an “Add Query” button on the toolbar.
Hi Dave – So, here is my situation. I am a BOXI R2 report writer. My sole purpose is to create complete and accurate reports. I do not have access to Admin functions, and can only work with the Universe(s) I see. Since personal data providers are not available in R2, is there any other way I can “unsynch” the tables so that I get a row for EVERY month, even if there is no data for “the months without an e in them” (using your scenario)?
this is a great blog, albiet a little over my head just now. I am a dinosaur Crystal Reports developer, and am new to BOXI.
I am in Rhode Island. Are you aware of any regional training I could consider?
Thanks – Lauren
If you have a calendar table, you can simulate what I did with Excel by creating a data provider that only returns calendar information. That’s coming in Part II of this post. 🙂
What if the rows I am trying to create are not based on a date? In my case, they are based on asset class. I need to show a row for each asset class, even those that have no data.
Then create a query that returns all asset classes without any measures, ensuring that every class exists. Create a second query that returns your asset classes with your measures. Follow the same pattern as shown in this block (some steps can be eliminated since the asset class will be the same object in two data providers it will automatically be linked) and see what you get. 😎
Thanks Dave. I will try this.
I tried your suggestion (multiple times and ways) and realized I may not have provided enough info.
———————–
Dimension [Reporting Period]
Dimension [Asset Class] includes: Cash, Mortgage, Public,
Dimension [Portfolio] includes: A,B
Measure [Market Value] = dollar amt
For each Reporting Period entered at prompt, I’d liek to see
A Cash 10
A Mortgage 0 (where there is no record for Mortgage)
A Public 15
B Cash 0 (where there is no record for Cash)
B Mortgage 4
B Public 9
Any help you can provide would be appreciated.
Hi Dave,
Interesting Post. I have created similar reports for my client. We have a date dimension table with which I do an outer join to get the same result.
Hi Dave
Really sorry for my late to answer(thaught that I will receave a notification email ones you will reply).
I m really happy to watch you site everyday(veeeeeeeeeeeeery useful!!!)
I understand now the part starting from relativeDate but I m not sure that I understand the part that I should do in the universe (creating the minimum object etc.)
Can you explain your point
Regards,
Part II is up, it details how to do some similar work with universe data instead of personal data.
http://www.dagira.com/2009/12/05/making-up-data-part-ii-using-universe-data/
Dave
Once again you have not failed to amaze me with your understanding of the tool! I am anxiously awaiting the Crosstab post because I have been working on that requirement for quite some time.
Roland
PS
I forwarded this information (and the universe solution) to my Universe designer to gets his feedback. Hopefully we will also have success.
This is cool! I wish I had known how to do this a few months ago. (Guess I would have if I had read your post!)
Thank you.
Hi Dave,
It’s nice seeing new tricks every time I visit your blog. For the above trick I’ve faced similar kind of situation where I’ve used a different way as follows:
I’ve added a new query(Q2) to the same report where I’ve taken only ‘month’ object in Q2 and then merged with the month dimension object in Q1, then used ‘month’ object from Q2 in the report which shows the months with zero(0) values as well. All worked fine.
Do you have any suggestions for me if I’m wrong ?
Cheers
Ravi
Hi, Ravi, please see Part II of this post for a solution more like what you described. 🙂
http://www.dagira.com/2009/12/05/making-up-data-part-ii-using-universe-data/
Dave, this is great, thanks. I have a problem that this goes some way to resolving:
I have an aggregated chart which shows the number of people who have had a child plan, by how long the plan has been in place for, in months. This is generally between 0 and 24 months, but they can stretch to 48 months, but these are rare. I need the chart to show the month numbers where there is no data, so it is clear to a report reader that the 48-month plans are that much further away from the 24 month plans.
My problem is that this max of months is not necessarily 48 months. It could be any value. I need the chart to somehow know the last value, and only display up to that, as at the moment, I am having to either manually apply a filter at report time (hinders scheduling) or accept that the chart will have a load of empty data at the end of it (looks clumsy).
I feel like I’m missing something with variables maybe, but can’t get what I’ve tried to work.
Any help gratefully received
Many thanks
Jamie
Hi Dave,
First of all I’d like to thank you for sharing your knowledge with us. I first started with BOB forumtopics and then I found your site. Your style of explaining these several topics is amazing. its more of like out of the box thinking.
Many Thanks
Arti
Hi Dave,
In the above post you have said that “In fact I can delete the file from my computer altogether and the report will still work”.
without the source file in desktop how the reoport can run?
Can u please confirm this..
Regards,
Ramanathan S
Hi Dave,
Is a report created using personal data provider can be scheduled?(I dont have access to WRC thats y I need your help)
Can u please confirm this too…
Regards,
Ramanathan S
If the data provider is marked as non-refreshable, then it doesn’t have to continue to exist. I can import the data from my spreadsheet, mark the data provider as non-refreshable, and remove the file without impacting the report at all. The data is cached inside the report. That means the report can be scheduled as well.
One of the rumors for 4.1 is that we can publish a spreadsheet to the repository, and then reference that sheet in my Web Intelligence report, and because it (the spreadsheet) is now an enterprise resource, it can be refreshed. Even during a scheduled refresh.
Hi Dave,
there is a server called Crystal Report Cache server and there is no server called Web Intelligence Cache server. As far as Webi is concerned there are two servers Webi report server and job server. Where the cached data get stored? which server does it ?
Regards,
Ramanathan S
Neither. The data is in the report.
Hi Dave
Your post is very helpfull. Thanks a lot.
Hi Dave,
Gr8 post! Thanks for the info provided. I am new to BO and was trying to use a personal data provider in my Webi report. I have some questions on using linking files within a query.
When updating a linking file within the query, we have the option of clicking on the box by the source file or using the Edit Settings box.
1. Do you know the difference between these two options and when they should be used?
2. When using the box by the source file, we sometimes get an error stating: Unable to create or update Excel personal data provider (WIS10884). Do you know what causes this error?
3. When I use the Edit Settings box to update a file, I lose formatting of summarized reports such as folding. What can be done to keep report formatting in tact?
I appreciate any assistance you can provide to give me a better understanding of how to handle linking files.
Thank You.
Hi Dave,
Thanks for your useful posts.
I have few questions on data provider
My BOXIR3.1 webi report is running for 45 mins to complete execution.
1)The Webintelligence report has 5 data providers. How the execution time is divided between these data providers? Is there any place we can specify and change the time taken for each data provider?
2) Out of these 5 data providers is it able to refresh one particular data provider?
3)If I identify one data provider is taking 40 mins to run then in webi or infoview is there any option to performance tune the report? Reducing number of report variables and data providers are most of them saying other than these are there any options to performance tune the report?
Can you please answer these questions..
Regards,
Ramanathan S
Hi, as mentioned elsewhere I don’t generally have the time to offer individual support on my blog, thanks for understanding.
Thank you for this post.. it has solved my issue which was pending for more than a week in the production environment. i haven’t received any solution from answer.sap or SCN if you call it..but here i got the right approach
Thanks you again