Aug 25 2009
What Are Unbalanced Data Providers And Why Should I Care?
One of the more powerful features of Web Intelligence (Desktop Intelligence as well) is the ability to combine data from more than one source into one document. This is done by creating multiple data providers, linking them up, and using the combined results in a report block. However, everything has to work out just right. Sometimes it doesn’t. 🙂
Merging Data Providers in Web Intelligence
Dimensions are the “keys” of a data provider. When two database tables are linked in a universe, certain columns are used to join them together. Dimensions serve this role in linking two data providers. When two (or more) data providers are built in Web Intelligence from the same universe they are automatically linked together using any common dimension objects. What happens when two different data sources are used? In that case, the report writer has to merge the information manually. And if the dimensions from each data provider are not identical, the report has what I call “unbalanced” data providers. That’s what I want to describe in this blog post.
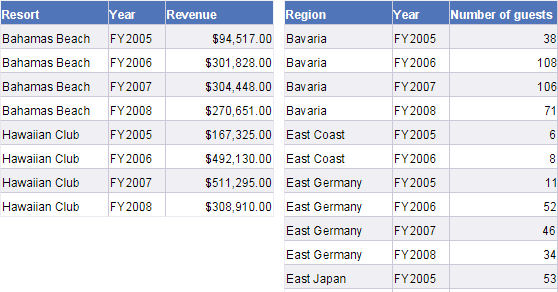
For my sample I will join two data providers from the Island Resorts Marketing universe. I am going to structure my queries in such a way that they will result in an unbalanced scenario. For my first query I will return Resort + Year + Revenue. For the second query I will return Region + Year + Number of Guests. Resort, Year, and Region are all dimension objects, of course, and Revenue and Number of Guests are my measures. Here are the raw results from each individual data provider. (I am using Web Intelligence XI 3.0 for this demonstration.)
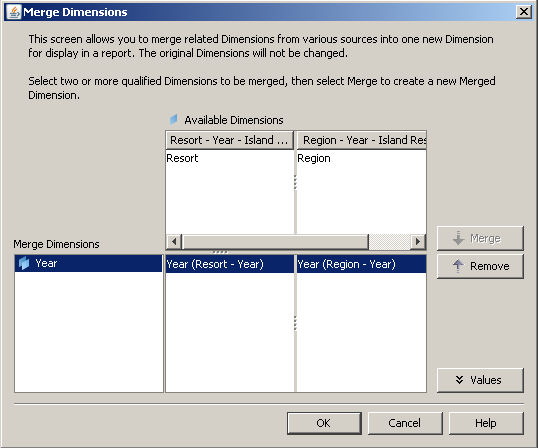
I have one common dimension. I also have two dimensions that are unique, one from each data provider. Since both data providers come from the same universe, the common or shared dimension value (Year) has already been linked, as shown here.
Because the Year object was already merged, I can create a report block that contains Year, Revenue, and Number of Guests. I can also do local variable calculations like Revenue per Guest using simple division.

This is what happens when everything works. 🙂 What if something doesn’t work?
Mixing Dimensions Generates Unexpected Results
This block shows what happens when I add Resort to the block shown previously.
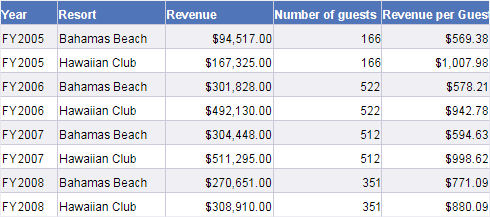
Notice anything interesting about the data? About the Number of Guests column specifically?
When the year repeats, the Number of Guests repeats. The Revenue measure seems fine. Before I explain this, let me exchange the Region object for the Resort object and show what happens.
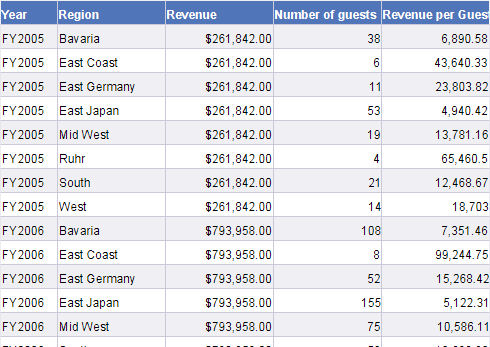
In this case, the Revenue column is strange and the Number of Guests looks okay. To make matters even more confusing, here’s what I get if I apply a Sum() to the Revenue column after doing a break on the Year…
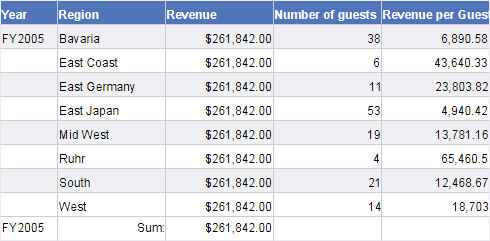
The sum on the footer is identical to the values displayed in the block! Any idea what’s going on? 😯
Measures Do Not Sum, They Project
The secret is that Web Intelligence does not sum a column of values like Excel does. A few weeks ago I discussed the difference between SQL Aggregation and Report Projection which helps explain this. Simply put: when a measure is combined with a set of dimension values in a block, the measure will project (roll up) based on the structure of the block. This is also called the context of the measure within the block. (Please note: The use of the word “context” in this case should not be confused with the concept of a context — set of joins — in a universe design.)
Because of the way I structured my queries, the Revenue context is determined by combinations of the Resort and Year objects. The context of the Number of Guests was set by Region and Year. The Year value is the only common dimension between the two data providers, which is why the block with only the Year dimension object showed valid data. However, if I include a dimension that is not part of a measure context, a problem occurs. When Region was added to the block the Revenue was wrong. When Resort was added the Number of Guests was wrong. In each case, the measure was out of context for at least one dimension.
To repeat: When I created the block with Year as the only dimension everything was fine. Each measure includes Year as part of its context. When I added Resort, the Revenue measure was still in context (and therefore showed the correct results) but the Number of Guests object was out of context. As a result, it used the only context it could (Year) and rolled up to that value, then repeated that value each time the year appeared on the block.
What about that weird behavior of the Sum() function? It turns out that a Sum() doesn’t really add up the column values. It does a projection instead. When the block included both Year and Region, the Revenue measure was valid for only the Year therefore it projected to that value. As a result, the measure value is repeated for each different Region in the body of the block as long as the Year is the same. Adding a break on Year created a footer for the block. Since the context for the footer was Year only, that made the Revenue projection (total) for the Year the same on the footer as it was for the body.
Unbalanced Dimensions
Now that I have been through all of that, let me finally explain what I mean by “unbalanced dimensions” as used in the title of this blog post. In my data providers I have Year as a common dimension and Resort hanging off of one side and Region hanging off of the other. Web Intelligence will prevent me from adding both Resort and Region to the block at the same time, but it will allow me to add one of them. Assuming I do that (add an extra dimension) I will have two dimensions from one data provider and one from the other. Two against one is unbalanced.
Resort, Year <-> Year
        Year <-> Year, Region
It doesn’t matter which side the extra dimension comes from either.
If you have more than one data provider the following rules apply.
- All common dimension values should be linked
- Measure context is defined by the dimensions in their source data provider
- A block with linked dimensions and measures works fine
- Unlinked dimensions from one data provider can be used; others will be designated as incompatible
- Measures from the data provider that includes the extra unlinked dimension will be fine
- Measures from the other data provider will repeat for each unlinked dimension value because they are at least partially out of context
With all of these complications, Web Intelligence does what it can to show the data properly, even to the point of having the footer totals be correct despite the presense of an unlinked dimension. It’s better to manage your data providers to avoid this challenge, but it’s nice to know how things work if you can’t do that. There are other techniques that can help (like creating variables to demote a dimension to a detail object, if that action is appropriate) but this post is long enough already. 😎

In some cases, the magic DeskI function Multicube() can be used to solve some problems. But it does not solve all problems.
Unfortunately, the function is not available in WebI.
Marek, the MultiCube() function will help if data providers are unbalanced “upwards” but not “downwards” as I have discussed in this post. There is no fix for the situation as I outlined it here because the data simply does not exist. There isn’t enough information. With an “upwards” unbalanced situation you can force the data down to the lower level, do the join, then roll it up. That’s what MultiCube() does.
Also, XI 3.x introduced the ForceMerge() function to provide this functionality in Web Intelligence. I have a draft of a post talking about that which will hopefully be done. Someday. 🙂
Hi Dave,
The information what you posted is, help’s me a lot
Marek, I realized tonight that my comment is hard to understand as far as the distinction I was making. So I guess my follow-up post needs to be written sooner rather than later in order to explain what I meant. 🙂
The next post is essentially done. I usually let a post marinate for a few days and go back and review it before publishing it, so expect it out sometime next week. It does a much better job of explaining that MultiCube() would not fix the scenario outlined in this post, and why.
Dave, so what is the best solution to fix the issue? Creating details can be useful as an extra piece of info on the report, but what if you want to project to that level? The measures only project to dimensions. Is the only way to graft the unbalanced dimensions into one provider or the other?
The biggest issue I have with details is that once you have the report defined, the data should be available at that level. Meaning, if you add a detail to a report and it is listed as a field it should be available to project as an aggregate. I realize today that the engine is only working with the base, separate Data Providers, but a nice enhancement would be to allow the combined report dataset to be used as the source of the calculation context.
Chris, in the exact scenario I used here, there is no fix that will return the correct results. The data simply isn’t there and can’t be manufactured.
In some cases where you might have a dimension object for order number and another dimension object for order date, and you know there is exactly one order date per order number, then you can use the technique you suggested. Create a detail variable for Order Date and link it to the Order Number dimension. In this scenario everything works because of the one-to-one relationship between the two pieces of data.
Measure objects can be projected to details. About the only thing you can’t do with detail objects are drill and rank. You can do a break or sort or filter on a detail object.
Dave, now i can understand unbalanced data providers but i do face lots of probelem on using multiple data providers and i posted this issue on BOB forum but no reply to all.
Ley say am using Union 1 and Union 2.
Am calling result set of data provider in one of the union and other am not calling at all. According to my condition data provider wont fetch any data and obviously one of the union should not give any data.Since other union am not calling result set of data provider it has to give the result but i dont find any single row fetched in the cube.
Is it any thing i missed in the data provider.
Thanks
Sriraman
HI Dave,
Greate Post.
In Xi R2 Can we include all dim & measure in single block.If yes then how
We have requirement like that
Ex-Year|Resort|Region|Revenue|no of guest
I have created Region & resort as a detail based on merged year it is giving all measure value perfectly but Resort is showing #Multivalue error
N_Kumar, you can’t “fool” the product like that. There are clearly more than one Resort value for each Year, so the #MULTIVALUE error would be correct. If the values are properly details, then they should be details at the universe level.
Hi Dave,
I am stuck very badly,last few days, with merged dimension issue.
I have 3 queries in my report,& all contains ‘Client_id’ as a dimension object & also a separate prompt object ‘Client_id'[actually, the report should run for a specific ‘client_id’ value].
In the report,i created a section based upon ‘Client_id’ that is also the merged dimension & drill down is enabled on the ‘Client_id.
Now, the problem is when i refresh all the 3 queries,it looks like below:
Client_id : BB002874
col1 col2 col3 col4
|——-|———–|——–|——-|
|——-|———–|——–|——-|
|——-|———–|——–|——-|
|——-|———–|——–|——-|
The block should produce data for client_id=BB002874 & as per universe hierarchy [there are several group under the client BB002874] if i click on ‘BB002874’, drill down up to group level should be shown.
now problem is drill down is not working though drill down is enabled upon ‘Client_id’.
pls suggest.
Thanks,
Pratik.
When you merge dimensions, the new merged dimension belongs to the
hierarchies of all dimensions involved in the merge.
When you drill upon a merged dimension, the application provides you the
query name and context for the object being drilled upon. You need to select
the appropriate context applicable for a document.
Hi!!
I’m working with webi report having 2 data providers pointing to 2 different universes (connected to 2 different Database, one is oracle 9 and other is oracle 10g)
Issue: we have to compare the serialnumbers available in the DBs using the 2 data providers and fetch only those records that are not matching in to the webi reports.
I was using the filter object in the first data providers as equal to the object from the other query (data provider2) but as this list going more than 1000 objects (Oracle DBs have limit on the list objects ) report is throwing the DB exception.
Limitation:
1) i cant go for the subquery as i’m having 2 different universe getting data from 2 different databases.
2) for query spliting using the rownum also impacts because the data will be dynamic not sure how many records we get in real time.
Request you to please guide me or suggest an alternate approach for this issue.
Many thanks
Hi Shiva, have you tried added 3 columns to your webi report?
– 1 column which is a merged dimension of the serial numbers from the 2 different data providers
– 1 column which is the serial number from the 1st data provider
– 1 column which is the serial number from the 2nd data provider.
In Document Properties, ensure ‘Auto-merge dimensions’ and ‘Extend merged dimension values’ are ticked.
Create a [Flag] variable, something like =If([Serial Number DP1] = [Serial Number DP2]) Then 1 Else 0
Finally add the [Flag] object to your report and filter the report where [Flag] = 0.
Hi Dave,
Great post, very helpful.
But do you know how to add incompatible object to a report without converting it to detail object?
because If i use it as detail it is giving #MULTIVALUE error.
If there is no other solution other than converting it to detail, then do u know how to remove this multi value error and make this detail object display segregated values.(without using min or Max function) as this will provide only 1 value, I want to display all the values.
Thanks
Have you heard the saying, “You can’t put a square peg in a round hole” before? 🙂 When you have something that is not linked and is therefore incompatible it’s because there is no relationship. What you’re describing (converting to detail) is the standard way to fix an unlinked dimension value. If there is more than one value, then it’s not valid as a detail and the #MULTIVALUE error is, in fact, the proper result. If you need to display everything, then you can try setting up a sectioned report and display two blocks, each one containing the values that are incompatible with the other.