Sep 16 2007
Variable Relative Block Positioning
The Challenge
Both Desktop Intelligence and Web Intelligence provide options to coordinate the placement of one block based on the size of another. This technique is used when you have more than one block on a page and you want the lower blocks to move up and down (or left and right) on the page based on the volume of data shown in the “relative” block. This works quite well with two blocks as shown below.

The block on the left in this case (the blue box) would be the anchor block. The block on the right (the red block) would float relative to the anchor block. I can accomplish this by right-clicking on the floating block and selecting Format Block. The Appearance tab includes the following settings that I can tweak:
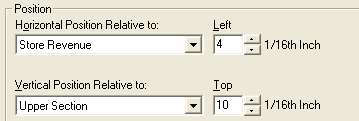
This technique works well for a chain of tables either horizontally or vertically. But what if I have the following scenario where I need to float blocks both horizontally and vertically?

The screen shots that will be included in this post are taking from Business Objects 6.5. The same concept should work in Web Intelligence as well, although I don’t at this time intend to post those instructions. If you don’t know how to simulate the “hide block” option in Web Intelligence you can review my prior post on Chart Alerters in Web Intelligence to see how that could work. Now on with the show.
The Setup
I created a query with Year, City, Store Name, Lines, and Revenue from the eFashion universe. My requirement calls for a three-block layout with the top-left block being store revenues, the top-right block is annual revenues, and the lower chart block will show lines revenues in a bar chart. Either the store block or the annual sales block could grow vertically. My requirement also calls for a prompt on the state. My challenge will be to figure out how to make the chart shift up or down based on either of the two top blocks. There is no option to make one block relative to two other blocks, so I will have to be creative. I like challenges like this. 🙂
Take Care of the Basics First
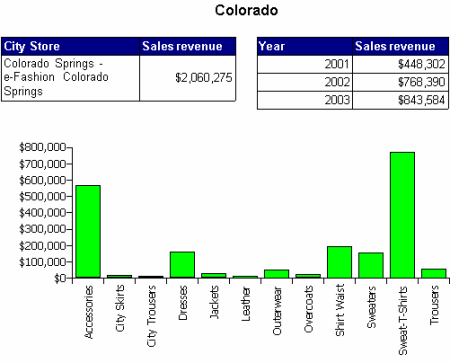
The first step I take to solve this challenge is to give each of my blocks a descriptive name. Since the annual sales block is to the right of the store sales block I will let it float horizontally based on the width of the store block. That’s fairly straightforward. Here is what the data looks like when I refresh the report for Colorado:
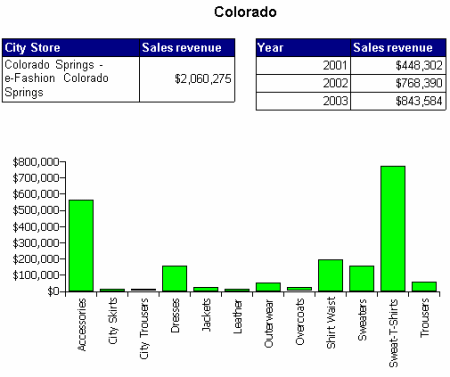
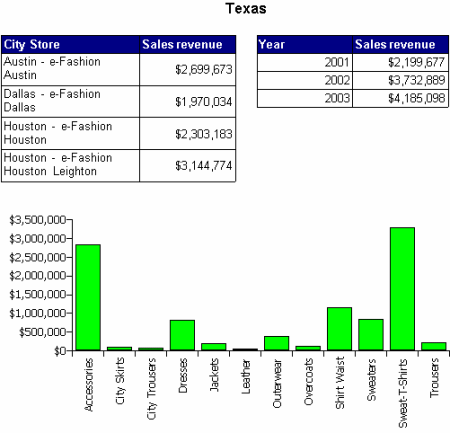
Everything looks fine. But when I select Texas for my second refresh notice the problem that I have:
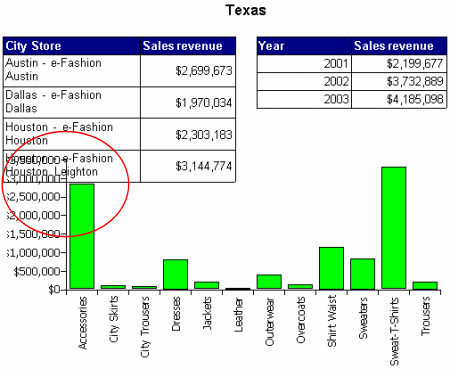
I could solve this by making the chart block float relative to the store revenue block. But that won’t help if there is only one store that has ten years of sales. In that scenario the annual sales block will encroach on the lines chart just like the store sales block has done in this case. I need to make the chart block float relative to two blocks rather than just one.
Variables to the Rescue
The solution requires me to be able to tell which block has more data. In this simple scenario it will not be too hard. I have two blocks each with one dimension each. If I count how many dimension values there are and compare the two, I will be able to tell which block is going to be bigger. Here is the variable that I created, called Which Chart:

This flag returns two distinct values: Year Chart or Store Chart. The formula is structured in such a way that the flag returns the name of the chart that I want to hide. But wait a minute, I only have one chart, right? How does one chart end up with two names?
Double Charts
In my earlier post on Chart Alerters I showed how to create two duplicate charts, one green and one red, and then set up formulas to only show one or the other. I think I can use that trick again here. 🙂 To solve this challenge I will create two charts. In this case the charts are identical other than their names. They even share the exact same location on the page, as shown here.
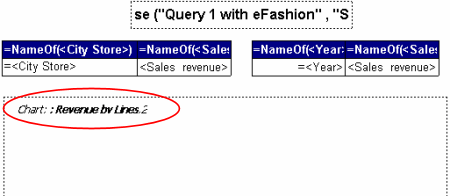
By the way, the Structure Mode option from Business Objects really helps in completing this report.
The final steps are to float each chart relative to one of the two upper blocks, and then hide based on the variable that I created earlier. If the annual block has more rows than the store block, then the chart that floats relative to the store block needs to hide since it won’t move down far enough. If the store block has more rows then the chart related to the annual block needs to hide for the same reason. Here are the screen shots of those settings:
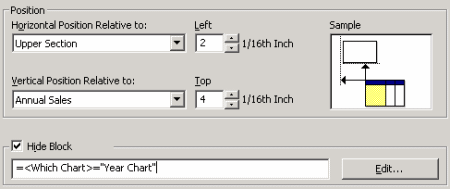
Notice that the float is relative to the Annual Sales block, and the hide formula is active if the chart to hide is the Year Chart.
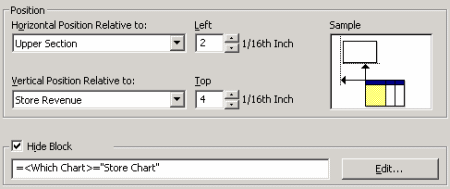
For the second chart the float is relative to the Store Revenue block, and the hide formula is active if the chart to hide is the Store Chart.
Test the Results
Once I finish creating my two charts, configure the relative float numbers, and create my hide conditions, how does it all look? The pictures tell the tale…
Summary
The purpose of this article was to show how to simulate the ability to float a block relative to two anchor blocks rather than just one. Since Business Objects does not provide this feature directly I used a variable, two charts, and a “hide block” setting instead.
Associated Downloads
- BusinessObjects 6.5 Sample
This download was built using the eFashion sample database provided by Business Objects. It should be accessable to anyone using version 6.5 or higher. The source file is zipped so you will need an unzipping utility to extract the file.

Hi Dave,
I need some help…
I need to make my table block floating based on the upper to table blocks.
Please guide me, how can I acheive this.
Thanks,
Vipul
That’s exactly what this post is about. Did you read and understand it? If not, that’s your first step. 🙂 There’s even a sample to download…
Nice one, Dave!
Now, I am using WebIntelligence XI R2 heavily at the current project (Can you hear me now…), and I am positioning tables and charts relatively to each other… so all seems well…
Ya think, huh?
Well, change one of the anchor tables such as removing rows/footers/headers, etc. and it blows the dependent tables/charts out of the water.
Dave – this is great information. I’m struggling doing the same formatting in Webi – BOXI…. where do I find this information?
Thanks,
Brian
dave – sorry disregard – just found it – need to hit the miniscule “…” button… guess I need a bigger monitor.
Brian, thank you for your comments. In my opinion, it’s always nice to have an excuse to justify a hardware purchase. 🙂
Hi Dave,
Using your method really helped me but I have one question if both upper blocks are empty / blank than both conditional block (Graph in your example) appears on the report. Can you please help me with any work around.
Thanks,
Wasi
Hi, Wasi, sounds like you have a problem. 🙂 I think for one graph you would have to check only one block, and for the other you would have to check both.
Thanks Dave, I found a work around. In one of the SQLs I add a union query with one blank record thus one block will always have some data.
Thanks 🙂
Dave,
My experience is primarily with Webi on XIr2 and above.
I’ve solved this problem in a different way. I create an empty section based on a dummy variable. As the blocks above push down, the section moves and moves the blocks below it.
Pseudocode:
Section 1
Block 1 Block 2
Section 2
/Section 2
Block 3 Block 4
section 3
/Section 3
Block 5
/section 1
Everything is part of section one, but the blocks are outside of Section 2 and Section 3
The downside to this is Webi isn’t really happy embedded sections. If you add a new one above, everything gets mashed together. Adding below is okay.
Hi, JJ, and welcome to my blog. It’s great to see other solutions for any of the technical challenges being faced, so thanks for sharing your tip. 😎
Can anybody tell me how to create a dummy variable in xi universe. What must be its select statement and where statement. I think it must be Character datatype.
Hi, Raja, if you have general questions not related to a blog post I suggest that you post on the community board BOB instead, thanks. 🙂
Hi,
Ever tried waterfall charts using this trick??
Hi, deepak, and welcome to my blog. To answer your question, no, I have never tried to create waterfall charts with this technique.
Hey Dave Thank you very much for sharing an ounce of knowledge from the Chunks you have.
My question… is not different.. its the same Wasi asked. I’m not able to understand your answer to Wasi. though the work around by Wasi works fine…. but i just want to avoid that Union.
Regards,
Shiva
The technique involves checking to see if a block was empty. What I suggested was that for one graph it should continue to work the same way, but the other graph would have to check for both “above” blocks, and if both are empty (the situation outlined in a prior question) then it should not appear at all. That would prevent both “lower” blocks from showing up at the same time if both “upper” blocks were empty.
Thanks for the quick response.
Regards,
Shiva
Hi Dave
The relative blog post is absolutely great. I have a slightly different requirement. I am positioning a pie chart adjacent(towards right) of the table in the report. Report has 2 secrions. I have enabled the Avoid Page Break proeprty for the table. I want both the graph & table to be displayed together in same page. Sometimes the table is displayed in next page & chart in upper page & vice versa
Any work around for this
Regards
Hi, I would try something sneaky like forcing the pie to be positioned 1 pixel below the top of the table block. I expect you already have relative positioning set to the right of the table. By setting a position relative to the top of the table block, when it (the table) moves to a new page then the pie should also.
Hi Dave,
Very useful post. I have a different problem. The report (BI 3.1) is comprised of cross tab block on the left and a horizontal block on the right so to the user it appears as one table. The horizontal block has a “Notes” object (column) with up to 500 characters which is set to autofit height, so the user can see all the comment. To get the crosstab table to align correctly, I added a summary column and replaced the sum with the Notes object and set its width to same width as it is in the horizontal table. Now everything lines up fine no matter on long a note is. However, I would like to “hide” the notes column in the cross tab report. Unfortunately the number of columns in the cross tab varies between 4 and 16 columns depending on the data selected. Is there a way to relatively position negatively the horizontal table over the Notes column added in the cross tab? The only thing I can think of is to make a duplicate of the crosstab, limit it to just one row shade and font it white, drop the Notes column and then relative position the horizontal block to that “hidden” cross tab report horizontally and then to the same thing the vertically that the crosstab is vertically position to.
Regards,
Mike
Thanks for the wonderful article! I had similar requirement from the client and your solution worked absolutely fine. Thank you.
Hi Dave,
Would you be able to provide some feedback on a similar blog that I wrote? It’s just that, I didn’t create multiple charts, I’m using a Blank cell as the Container component (of Dashboard/Xcelsius) here.
https://blogs.sap.com/2016/08/30/relative-positioning-of-a-block-with-respect-to-2-or-more-blocks/
Thanks,
Mahboob Mohammed
Hi. Please help me. I need to add a left footer to a crosstab. Its kinda similar to right footer but I need a column on left hand side.